Optimizing for performance
General optimizations
Section titled “General optimizations”- Most game code should be in
_PhysicsProcess. And for most singleplayer games, you’ll probably pick onephysics_ticks_per_secondfor everyone, but they can obviously run at whatever framerate they want. As a result, players on monitors that are, say, 240hz won’t have game logic running at 4x the frequency as players on a 60hz monitor.
Niche optimizations
Section titled “Niche optimizations”- If you include other assemblies from your C#
.sln, this issue may be relevant since optimizations need to be enabled on those assemblies. This is as easy as putting this file alongside your.slnfile. - If you have the Steam performance overlay turned on, it can negatively affect performance by a lot in some cases. Try turning it off and just playing the game when getting close to launch since your players typically won’t have it on.
Marshalling
Section titled “Marshalling”- Practically anything you do involving Godot from C# requires marshalling (see some details here). A lot of times, what this means is caching properties to save calls into Godot. As a very simple example, even something like
SomeNode.Visiblewill need to marshal into Godot, so if you can keep your ownbool isVisibleand reference that, it’ll be much faster. See this issue for some concrete numbers in a minimal repro.- I don’t recommend doing this ahead of time; profile using something like dotTrace (performance profiling) to find out whether there’s even a noticeable impact from these.
Sampling profilers
Section titled “Sampling profilers”If you use a sampling profiler like dotnet-trace to measure your performance, you’ll only ever find the longest-running code, but it may not actually be problematic code. For example, if you sampled an application that simply did integer math, one of those lines might take 50% of the total runtime, but that doesn’t mean it’s a problem. I.e. you should always see 100% utilization when sampling even for an empty loop.
If using dotTrace (performance profiling), look at the different kinds of profiling types.
Investigating stutters/spikes
Section titled “Investigating stutters/spikes”If your game occasionally drops from its normal framerate, here are some tips that can help:
- See if it’s due to garbage collection. Allocations aren’t actually a problem (usually); it’s cleaning them up that’s the problem. I.e. you can make 1000 things with no real performance impact, but after there are no more references to them, the GC will eventually run.
- To investigate these issues, try dotMemory.
- It could be a good idea to measure stutters in the game just by checking if
delta > 0.03or so in_Process, then render that count on-screen (at 60 FPS,deltashould hover around0.01667, so0.03just represents a number large enough to potentially be problematic). - You can get the framerate of your game using
Engine.GetFramesPerSecond. - It’s possible that you’re doing something that just takes a long time. Using any sort of sampling profiler will probably make it difficult to isolate unless there’s a timeline that you can narrow down your action to. For example, suppose you perform an action in your game which takes 10ms extra inadvertently. If you profile the entire runtime, it won’t show up as a hotspot because it’s only 10ms.
- Another thing you can do is profile individual functions by using something like
Stopwatch:Stopwatch stopwatch = Stopwatch.StartNew();// PUT THE THING YOU WANT TO PROFILE HEREstopwatch.Stop();double elapsedMicroseconds = stopwatch.ElapsedTicks / (double)Stopwatch.Frequency * 1_000_000;
- Another thing you can do is profile individual functions by using something like
Unnecessary allocations
Section titled “Unnecessary allocations”String concatenation
Section titled “String concatenation”- String concatenation (e.g.
$"Money: +{delta}") causes allocations. - Some string concatenation is practically necessary, e.g. showing a countdown timer like “Time remaining: 52s”. You could make this two separate labels, e.g. “Time remaining:” and ”52s” and throw them into an
HBoxContainerin Godot, but depending on the string, it may make it harder/impossible to localize. For example, imagine this semi-contrived scenario where you actually write “There are 52 seconds remaining”; you pretty much need concatenation in that case.
Workarounds:
- Cache concatenated strings.
- For BBCode, see if you can do without the extra BBCode. For example, if you’re only ever rendering an entire string centered, bold, etc., then just put that into the
.tscnfile. E.g.$"[center]{title}[/center]would just becometitle, and you would change the horizontal alignment of theRichTextLabelto be centered.
GetChildren
Section titled “GetChildren”It’s quite reasonable to call GetChildren once during some kind of initialization, but it’s a bad idea to do it during a hot path for this reason: 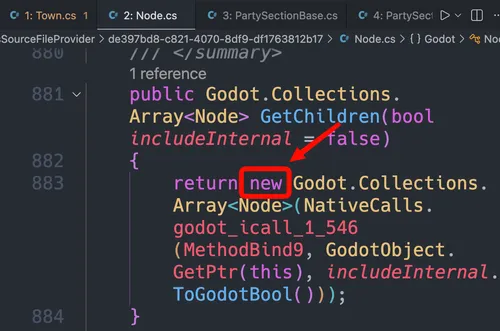
Before I realized this, my thinking was something like: the scene tree already keeps track of them, so why would I duplicate that in C#? But it’s much better to cache the children and invalidate the cache whenever you know the children change.
An easy pattern for this:
// Old code:public IEnumerable<Adventurer> GetAdventurers(){    return _adventurersNode.GetChildren().OfType<Adventurer>();}
// New code:private List<Adventurer>? _cachedAdventurers;
public IEnumerable<Adventurer> GetAdventurers(){    _cachedAdventurers ??= [.. _adventurersNode.GetChildren().OfType<Adventurer>()];
    return _cachedAdventurers;}
private void ClearAdventurerCache(){    _cachedAdventurers = null;}
StringName and NodePath
Section titled “StringName and NodePath”Note: all of this section may eventually be addressed by this PR.
There are implicit conversion operators between some string-related classes for ease of use. However, this can result in hidden allocations. For example, StringName and NodePath are both easy gotchas:
if (@event.IsActionPressed("ui_accept")) {} // this will allocate a StringName every time it's calledGetNode<Button>("%Button"); // this will allocate a NodePath every time it's calledThe impact of this is that these both need to eventually be garbage collected. Done in small amounts, that’s not usually a problem. Either way, the fix is simple: make static readonly fields and use those:
public static readonly StringName UiAccept = "ui_accept";public static readonly NodePath ModulateAlpha = "modulate:a";This solution works well for strings that you know ahead of time (e.g. "ui_accept" won’t change throughout your program), but sometimes you have a dynamic string. For those, setting up a simple cache can be good:
private static readonly Dictionary<string, StringName> _cSharpToGodotCache = [];private static readonly Dictionary<StringName, string> _godotToCSharpCache = [];
public static StringName FromCSharp(string str){    if (!_cSharpToGodotCache.TryGetValue(str, out StringName? value))    {        value = new StringName(str);        _cSharpToGodotCache[str] = value;    }
    return value;}
public static string FromGodot(StringName stringName){    // similar to the above}
You may even want an extension method to make it easier to call these:
public static StringName ToGodot(this string str){  return GodotStringNames.FromCSharp(str);}
// ...later:if (@event.IsActionPressed("ui_accept".ToGodot())) {}
I suggest using dotMemory to help find these sorts of issues, e.g. you can search the resulting allocations for Godot.StringName.op_Implicit(String).
Closures and lambdas
Section titled “Closures and lambdas”This is a very tricky one: delegate allocations with closures can happen even if the code is never explicitly hit:
public void ThisAllocates(int num){ if (true) { return; } var fn = () => { Console.Out.WriteLine(num); };}We never make it past the return, but an allocation will still happen every time you call ThisAllocates due to the capturing closure.