Rider memory-allocation profiling
Overview
Section titled “Overview”- If your program/game seems to lag every once in a while, it could be due to the garbage collector cleaning up heap allocations. Rider has tooling in the form of dotMemory (which, at the time of writing, is an extra plan (dotUltimate) on top of Rider (reference)).
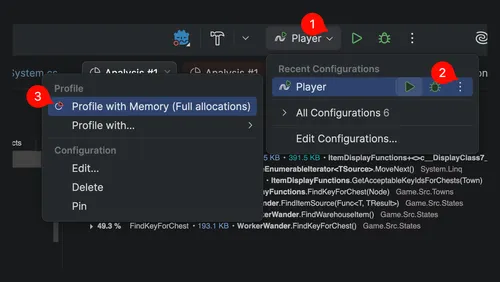
- Follow the buttons in the picture (reference):
-
- While running, click “Get Snapshot” occasionally.
- After you have at least two snapshots, you can select ”✅ Add to comparison” and click “View memory allocations” to see stack traces for each allocation.
Troubleshooting
Section titled “Troubleshooting””AllThreadsRoot” shows up in the allocations
Section titled “”AllThreadsRoot” shows up in the allocations”For example, here’s when I was profiling my game in Godot:
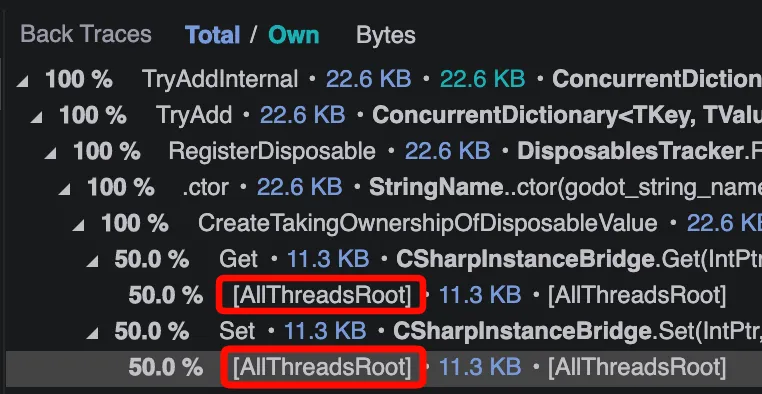
You can’t expand AllThreadsRoot, so even though my code was indirectly causing it, I was unable to get any details from dotMemory itself. As far as I can tell, this is some static context or GC root; it’s essentially just saying you won’t get more information through this. In my specific case, it came from this code, which has the attribute UnmanagedCallersOnly. As such, I think some static thing in the the game engine (Godot) was responsible for this.
Also, to close the loop on this particular note, in my case:
- It was caused by this issue.
- I could have set a breakpoint in
GetandSetand then logged the arguments and .NET types to potentially get more insight into how I may have indirectly caused this.- To modify external code (e.g. to add print statements), you can use dnSpy on Windows. Alternatively, in my case, I could probably have just built Godot from source and modified the functions directly.