CloudWatch
Created: 2018-11-30 09:16:01 -0800 Modified: 2020-03-26 15:30:05 -0700
Basics
Section titled “Basics”- It’s highly recommended that you install a log-viewing tool like saw or awslogs. I think saw is preferred and it’s just a “wget” / “dpkg” set of commands away from installation. Once I installed this, I did “saw groups” and then “saw watch <particular group name>” to see the logs in realtime. Alternatively, you can do something like “saw get —start -10m <name of group>” to get the logs from the last 10 minutes.
- If “saw groups” doesn’t return anything when you think it should, then you may have some kind of error with authentication, e.g. your VM has time drift issues.
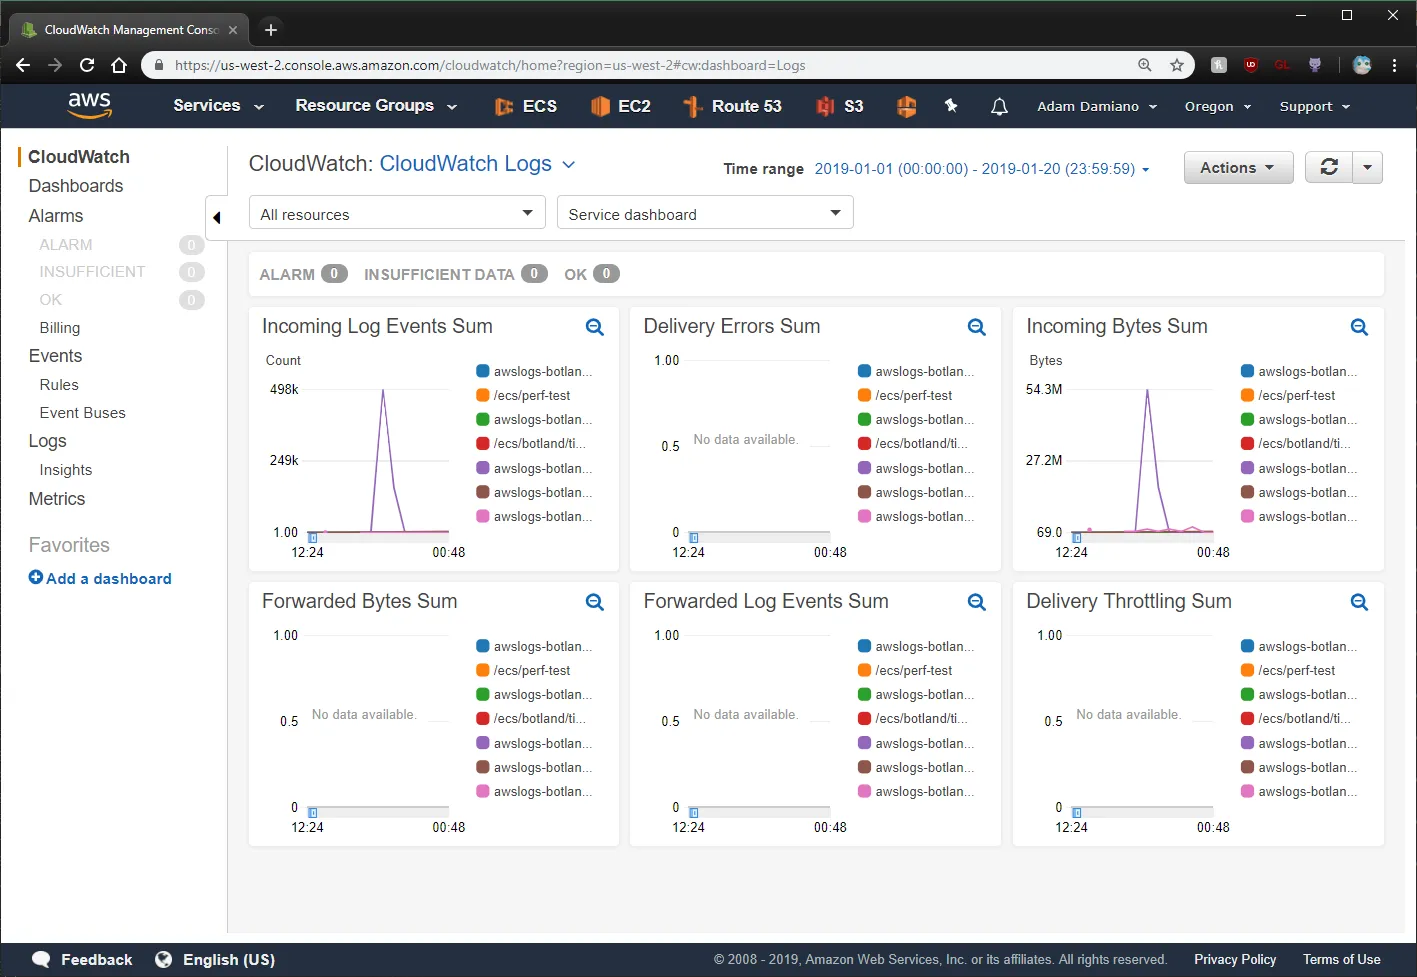
- To view usage in a given timeframe, go to CloudWatch → CloudWatch (at the left on top) → CloudWatch Logs → Choose your time range
Getting notifications when your ECS service scales up or down (autoscaling)
Section titled “Getting notifications when your ECS service scales up or down (autoscaling)”I ended up doing this through the AWS Console after I used Terraform to set up an aws_appautoscaling_target and aws_appautoscaling_policy. In the UI, click an alarm, choose Actions → Modify, then you should see an AutoScaling Action at the bottom. Click “+Notification” to add a notification:
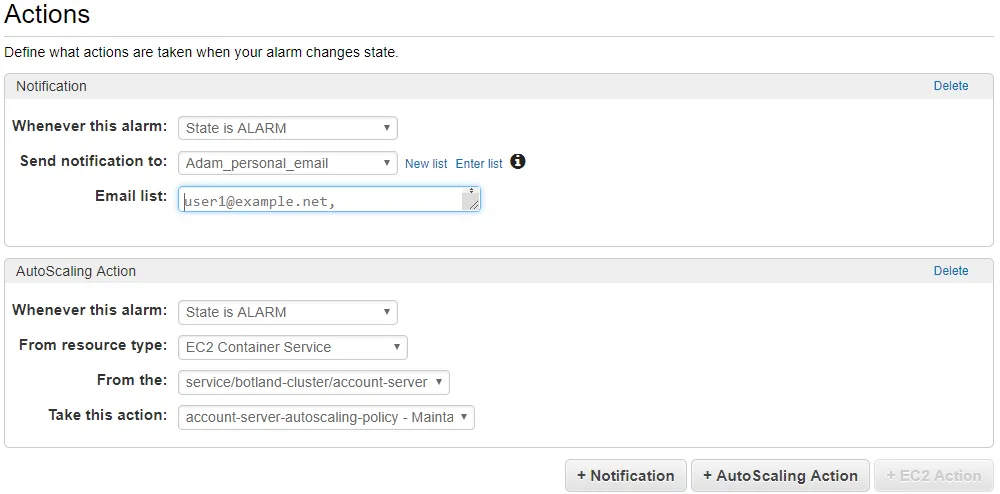
After that, you’re sent an email that confirms that you want to subscribe, that way you can’t just spam random people with this.
There’s probably a way to do this directly with Terraform (e.g. here), but I didn’t really look into it since the UI route took a few seconds.
Troubleshooting
Section titled “Troubleshooting”Metrics don’t show spikes in CPU/memory usage reliably
Section titled “Metrics don’t show spikes in CPU/memory usage reliably”Consider this CPU usage chart below:
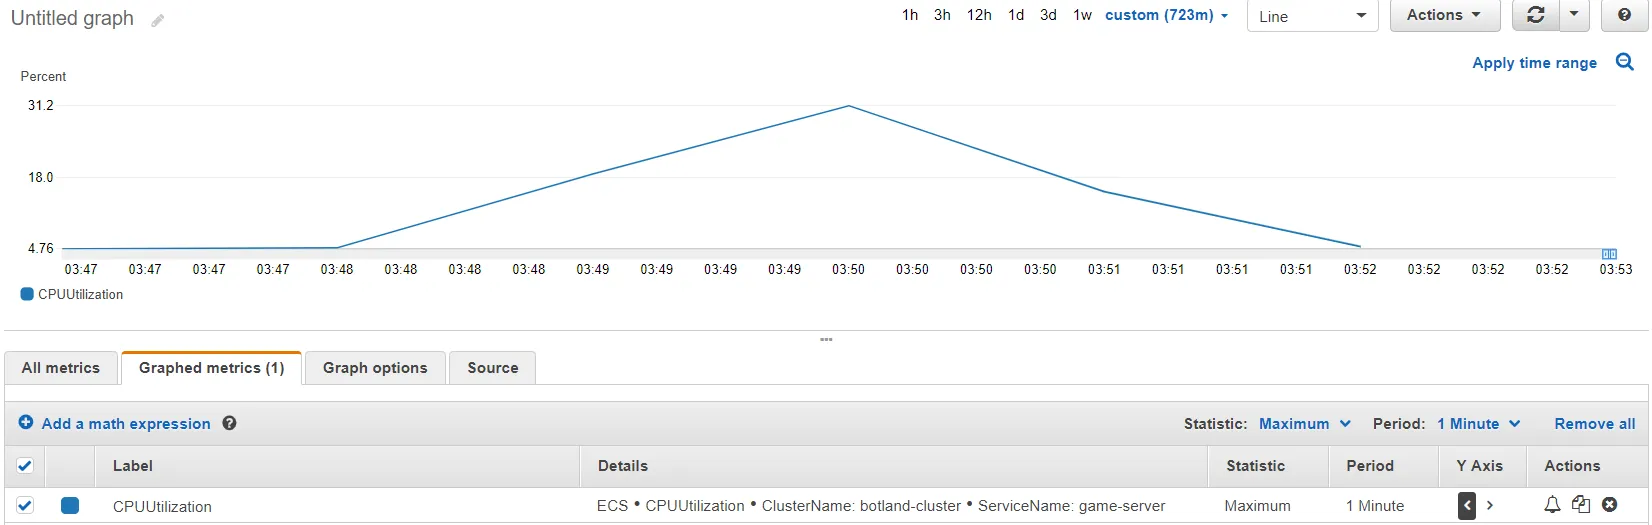
I know for sure that I was using 100% CPU for a very short period of time (i.e. something like 400 ms). Amazon doesn’t sample CPU frequently enough for that to show as the maximum usage for any given minute.