Mobile debugging
Created: 2017-02-16 11:30:41 -0800 Modified: 2019-07-19 12:34:20 -0700
A working way to debug Safari on iOS
Section titled “A working way to debug Safari on iOS”Note: this is almost entirely for JavaScript debugging, not for elements/styles. The Safari engine on MacOS is different from on iOS.
https://github.com/google/ios-webkit-debug-proxy
I installed this using Scoop (the instructions were easy).
(note: to uninstall scoop, run this command: “scoop uninstall scoop”; I had to uninstall scoop in order to use yarn for botland-front)
- Some gotchas
- Make sure the iPad is connected via USB
- Make sure Safari has the web inspector enabled in the iOS settings
- I had to get this: https://github.com/artygus/webkit-webinspector
This is the command I ended up using even to debug with the webkit adapter:
ios_webkit_debug_proxy -f chrome-devtools://devtools/bundled/inspector.html
From my computer, connect to localhost:9222 to see a right-clickable link that really just directs you here: chrome-devtools://devtools/bundled/inspector.html?ws=localhost:9222/devtools/page/2
This works except that the console doesn’t show anything.
If localhost:9222 doesn’t show a clickable link in the list, then refresh the browser on the iPad.
If the webtools don’t work, then you should check out localhost:9222 to see if “page/number” changed.
2/16/2017
I’m just combining some notes for now about how I’ll eventually debug web pages on mobile.
HiDeoo: If you don’t have a Mac to debug on Safari, you can also use http://jsconsole.com if you want, you type ":listen" and it’ll give you a script to inject which will start a remote debug session on your device
EveryJuan: @Adam13531, I would HIGHLY recommend getting an android emulator and running chrome developer tools on it - it is much easier to debug mobile issues
Just use Android SDK or genymotion.
XillyGames: http://mobiletest.me/ - Also seems to work pretty well
Debugging on Android (reference)
Section titled “Debugging on Android (reference)”https://developers.google.com/web/tools/chrome-devtools/remote-debugging/
The instructions are really straightforward, so just follow them and you’ll be up and running in about 3-5 minutes.
Keep in mind, especially for rendering performance, that this absolutely tanks your framerate. Just having devtools open and sending from device to desktop Chrome seems to eat at least 50% of the framerate. Having the FPS meter open for rendering on top of that will eat another 10-20%.
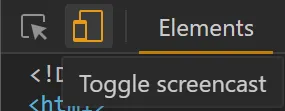
Note: if you can’t see the screen at all, you may need to click this toggle button:
If DevTools can’t find your device, then maybe try connecting your device directly to the computer with a USB cable rather than going through an extender or hub.
Wi-Fi debugging on Android (reference)
Section titled “Wi-Fi debugging on Android (reference)”Note: I never actually tried this. Also, you don’t need to connect just to be able to find the IP address.