Chrome
Created: 2017-01-26 16:12:14 -0800 Modified: 2022-03-06 19:18:46 -0800
Tampermonkey (a la Greasemonkey / Greasemetal) (reference)
Section titled “Tampermonkey (a la Greasemonkey / Greasemetal) (reference)”While Chrome supports user scripts out of the box, it’s apparently a pain (reference).
- Documentation (reference)
- @match (reference)
- This is how you change the URL to run on, not through the “Settings” page.
- @match (reference)
- Debugging scripts (reference)
- Dashboard → Settings → General → Set config mode to Advanced → Debug scripts
- Then add a “debugger;” statement to your script.
Here’s a simple script I wrote to make certain tags stand out on Twitch. It shows the basics at the very least. I would have used Lodash if I felt like including another external script beyond Jquery.
// ==UserScript==// @name Highlight Twitch tags// @namespace http://tampermonkey.net/// @version 0.1// @description Highlight Twitch tags that I care about to make browsing easier.// @author Adam13531// @match https://www.twitch.tv/directory/game/*// @grant none// @require https://code.jquery.com/jquery-latest.js// ==/UserScript==
const tagsICareAbout = [  {    text: "first playthrough",    styles: {      backgroundColor: "green",      fontSize: "2.2em"    }  },  {    text: "casual playthrough",    styles: {      backgroundColor: "green",      fontSize: "2.2em"    }  },  {    text: "blind playthrough",    styles: {      backgroundColor: "green",      fontSize: "2.2em"    }  }];
function highlightTags() {  const allTags = $(".tw-tag > div");
  tagsICareAbout.forEach(tag => (tag.text = tag.text.toLowerCase()));
  for (let i = 0; i < allTags.length; ++i) {    const tagElement = allTags[i];    const tagText = tagElement.innerText.toLowerCase();    const matchedTag = tagsICareAbout.find(tag => tag.text === tagText);    if (matchedTag) {      const { styles } = matchedTag;      for (let styleKey in styles) {        const styleValue = styles[styleKey];        tagElement.style[styleKey] = styleValue;      }    }  }}
$(document).ready(() => {  setInterval(() => {    highlightTags();  }, 1000);});
Note: the setInterval is needed because scrolling can cause new streams to load that weren’t previously on the page. Actually, even without scrolling, I think Twitch tries showing you the base page as fast as possible, then it populates streams shortly afterward.
Finding links (like apostrophe in Firefox)
Section titled “Finding links (like apostrophe in Firefox)”10:41 YgTSkedog: Apparently ctrl+f and then ctrl+enter skips the need to hit escape and then enter for links Adam 10:41 YgTSkedog: Yeah, there is a chrome plugin here: https://chrome.google.com/webstore/detail/quick-find-for-google-chr/dejblhmebonldngnmeidliaifgiagcjj?hl=en-US
Filtering CSS
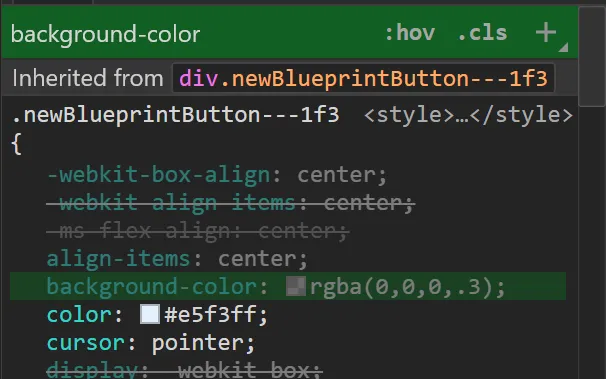
Section titled “Filtering CSS”Above where you see CSS in the Elements pane, there’s a filter input that you can type into:

This makes it very easy to figure out where a particular bit of CSS is coming from.
Clearing the cache
Section titled “Clearing the cache”Apparently you can’t always rely on the Networking tab’s “Disable cache” checkbox. For cases like that, you can use the Application tab’s “clear site data” button under “clear storage”.
Note: this still seems to be necessary even if you use the “Empty Cache and Hard Reload” button that you get from long-pressing the Refresh button when DevTools is open.
Multiple cursors
Section titled “Multiple cursors”I think it’s Chrome 55 that introduced multiple cursors. For example, if you’re in the console or the Sources tab, you should be able to ctrl+click (and maybe there’s another shortcut) to get multiple cursors.
Debugging devices
Section titled “Debugging devices”12:25 EveryJuan: chrome://inspect on your PC, if the device is on usb
12:25 HiDeoo: Works over Wifi too
12:25 VitoGaming03: chrome://inspect/#devices remote debugging
”3D Mode” (layers)
Section titled “”3D Mode” (layers)”mitchell486: Adam13531 Google says Restart Chrome.Open Chrome DevTools.Click “Settings” (the gear icon in the upper right corner)Click on “Experiments” in the left menu.Check the “Layers panel” option.Close, then re-open Chrome DevTools.Now you should see the “Layers” tab.
Code coverage
Section titled “Code coverage”To figure out where you may benefit from tree-shaking or code-splitting, you can look at the Coverage view in Chrome to get something like this: https://pbs.twimg.com/media/C8fqzKTUwAAmt5K.jpg
To use this, click the three vertical dots to the left the Console tab and choose “Coverage”, then click the refresh button and your app will reload while recording.
Devtools
Section titled “Devtools”http://mo.github.io/2015/10/19/chrome-devtools.html
Shortcuts
Section titled “Shortcuts”- Escape will show and hide the “drawer”, which is where you see things like Remote Devices or the performance monitor (Chrome 64)
Filter by NOT showing certain words
Section titled “Filter by NOT showing certain words”Normally, you type something like “server” into the filter to find all server-related messages. However, you could type “-client” (minus sign then “client”) to find all messages that DON’T contain “client”. You can also type regexes like “/hello/“.
Code snippets (reference)
Section titled “Code snippets (reference)”If you find yourself typing the same thing all the time, e.g. copy(foo.bar.baz), you can make a snippet for it via ctrl+shift+P → Snippets. To find them, you need to expand the left side of the DevTools and choose the “Snippets” tab:

[11:12] HiDeoo: Note for interested people about that snippet feature: you can also do Ctrl + O and type “!snippetName”, slightly quicker
Quick references to elements
Section titled “Quick references to elements”By clicking an element in Devtools, you will see something like this

You can then use 1, $2, etc. are the previous elements.
r.setState, etc.
Ctrl+shift+P is your best friend at first
Section titled “Ctrl+shift+P is your best friend at first”This is just like Sublime’s ctrl+shift+P in that it will give you a bunch of Chrome-related options, e.g. switching between panels.
Copy text from the clipboard
Section titled “Copy text from the clipboard”If you ever have something in the console that you want to copy, you can use the built-in “copy()” command, e.g.
copy(“This will be copied to the clipboard”);
3/22/2021 - note: if there’s an HTML element whose ID is literally the word “copy”, then you may have to delete/change its ID to get back the original “copy” function.
Pinning expressions in the console
Section titled “Pinning expressions in the console”
The eyeball button (“Create live expression”) will let you make a “Watch” expression sort of like how the Sources tab does it.